Infographics are a visual representation of information, data, or knowledge. They are designed to present complex information in a way that is easy to understand and visually engaging. Infographics are made up of various elements such as text, images, charts, graphs, icons, and other visual aids that work together to convey a message or tell a story. The goal of an infographic is to communicate information in a way that is clear, concise, and memorable.
Infographics can be used for a variety of purposes, such as educating people on a particular topic, summarizing research findings, or promoting a product or service. They are commonly used in marketing, journalism, education, and other fields where effective communication of information is critical.
In this blog post, we’ll walk you through the step-by-step process of making an infographic in Canva.
How to Make an Infographic in Canva? [Step by Step Guide]
Canva is a popular online graphic design platform that offers a variety of templates and tools to create professional-looking infographics. Here are the steps to create an infographic in Canva:
Step 1: Sign in to Canva
The first step is to sign in to Canva.

Go to canva.com and sign in to your account. If you don’t have an account, you can create one for free. Once you’re signed in, you’ll be taken to the Canva dashboard where you can start creating your infographic.
Step 2: Choose the infographic template
Once you’re signed in, search for “infographic” in the search bar at the top of the page. Canva offers a range of pre-designed templates to choose from. You can select the one that best fits your needs, or you can start from scratch.

Step 3: Customize the design elements
The next step is to customize the design elements of your infographic. This includes adding or removing shapes, icons, charts, and images. You can also change the colors, fonts, and backgrounds to fit your branding or personal style. To add a design element, simply drag it from the sidebar on the left and drop it onto the canvas. To customize it, click on the element and use the editing tools that appear.

Step 4: Add your content
Once you’ve customized your design elements, it’s time to add your content. This can include statistics, data, or other information that you want to convey in your infographic. To add text, simply click on the “text” button in the sidebar and type in your content. To add images or charts, click on the “elements” button and choose the type of element you want to add.
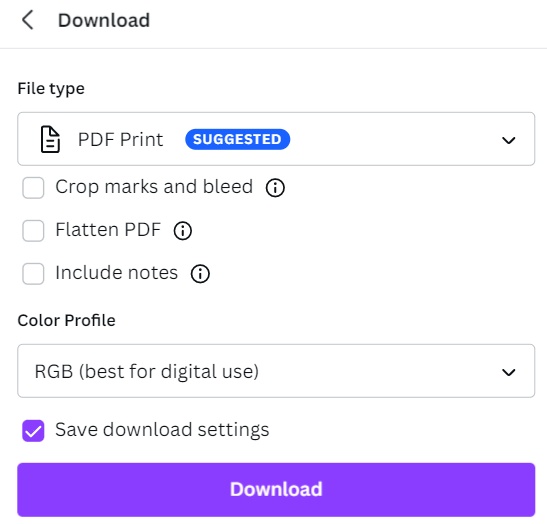
Step 5: Save and export
After you’ve finished designing your infographic, it’s time to save it and export it. To save it, simply click on the “save” button in the top right corner. To export it, click on the “download” button and choose the format you want to export it in (e.g. PDF, image file). Canva offers different file formats, sizes, and resolutions to choose from depending on your needs.
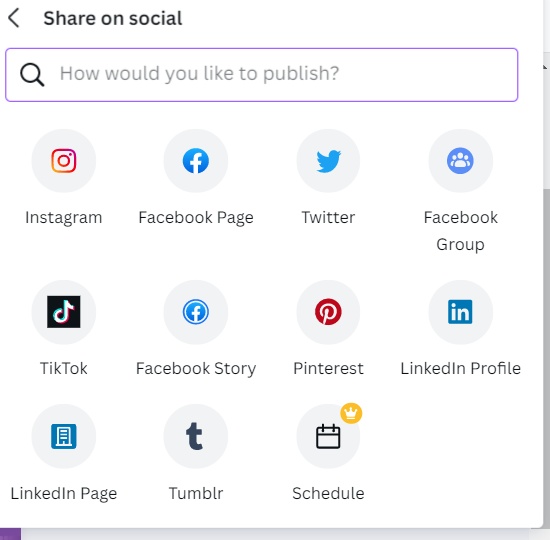
Step 6: Share and promote
Once your infographic is ready, it’s time to share it and promote it. You can share it on social media, your website, or other marketing channels to reach your audience and promote your message. Canva also offers a share link feature that allows you to share your infographic with others directly from Canva.
What are Benefits of Using Infographics?
Here are some of the benefits of using infographics:
1. Easily Digestible Information
Infographics make complex information easy to digest by presenting it in a clear and visually appealing format. By using charts, graphs, images, and other visual elements, infographics break down complex data and make it more accessible.
2. Engages the Audience
Infographics are eye-catching and can capture the attention of your audience quickly. The use of colors, icons, and visuals makes the content more interesting and engaging. People are more likely to remember information presented in an infographic than information presented in a text-only format.
3. Increased Understanding
Infographics provide a visual representation of information that can make it easier for people to understand and retain information. By presenting information in a visually appealing format, it can increase comprehension and retention of the information.
4. Improved Memory Retention
Studies have shown that people remember information better when it is presented in a visual format. Infographics are an effective way to help people remember important information, data, or statistics.
5. Increased Social Shares
Infographics are highly shareable on social media platforms, making them a great way to increase your brand’s reach and engagement. Infographics are easy to share on social media platforms like Twitter, Facebook, and Instagram, making them a great way to boost your social media presence.
6. Improved SEO
Infographics can improve your website’s SEO (search engine optimization) by generating backlinks to your website. When people share your infographic on their website, it creates a backlink to your website, which can improve your search engine rankings.
Different Types of Infographics
Infographics come in different shapes and sizes, and each type is designed to serve a specific purpose. In this article, we will explore the different types of infographics.
1. Statistical Infographics

Statistical infographics, also known as data visualizations, are used to display complex data in a clear and concise way. They are often used to illustrate trends, patterns, and relationships between different data points. Examples of statistical infographics include bar charts, line graphs, and pie charts.
2. Informational Infographics
Informational infographics are used to convey information in a visually appealing and engaging way. They are often used to present facts, statistics, or other information in a way that is easy to digest. Examples of informational infographics include timelines, maps, and process diagrams.

3. Geographical Infographics
Geographical infographics are used to represent geographic data, such as population density, weather patterns, or demographic information. They often use maps or other geographical features to display this data. Examples of geographical infographics include heat maps, choropleth maps, and cartograms.

4. Comparison Infographics
Comparison infographics are used to compare two or more data points or concepts. They are often used to highlight the differences or similarities between different ideas or products. Examples of comparison infographics include Venn diagrams, bubble charts, and stacked bar charts.

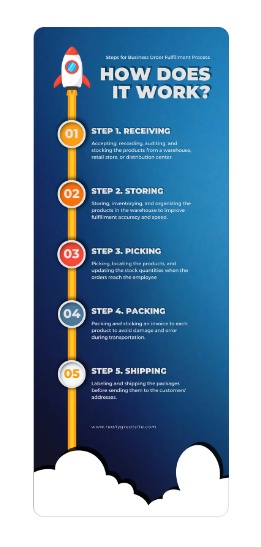
5. Process Infographics
Process infographics are used to illustrate a series of steps or a process. They are often used to explain complex concepts or procedures in a simple, easy-to-understand format. Examples of process infographics include flowcharts, timelines, and diagrams.
If you want to become a Canva expert you can go and check these articles,
How to add subtitles to a video in Canva
How to erase image or object in Canva
How to add Hyperlinks in Canva
How to make a transparent logo in Canva for Free
How to Create flowchart in Canva
How to Cancel a Canva Pro Subscription
How to create a business card template in Canva
How to schedule instagram posts on Canva
Where does canva get its images
Conclusion
Canva makes creating infographics easy and accessible for anyone. By following these six steps, you can create a professional-looking infographic in no time. Whether you’re using it for business or personal use, infographics are a great way to communicate information in a clear and visually appealing way.
Thank You for reading!


![40 Best SEO Audit Tools Experts using in 2023 [Free & Paid]](https://quatmarketing.com/wp-content/uploads/2023/06/best-seo-audit-tools-120x86.webp)